First Quarter 2019
“We believe we are well positioned to participate in any advance while also providing downside protection should the market weaken further.”
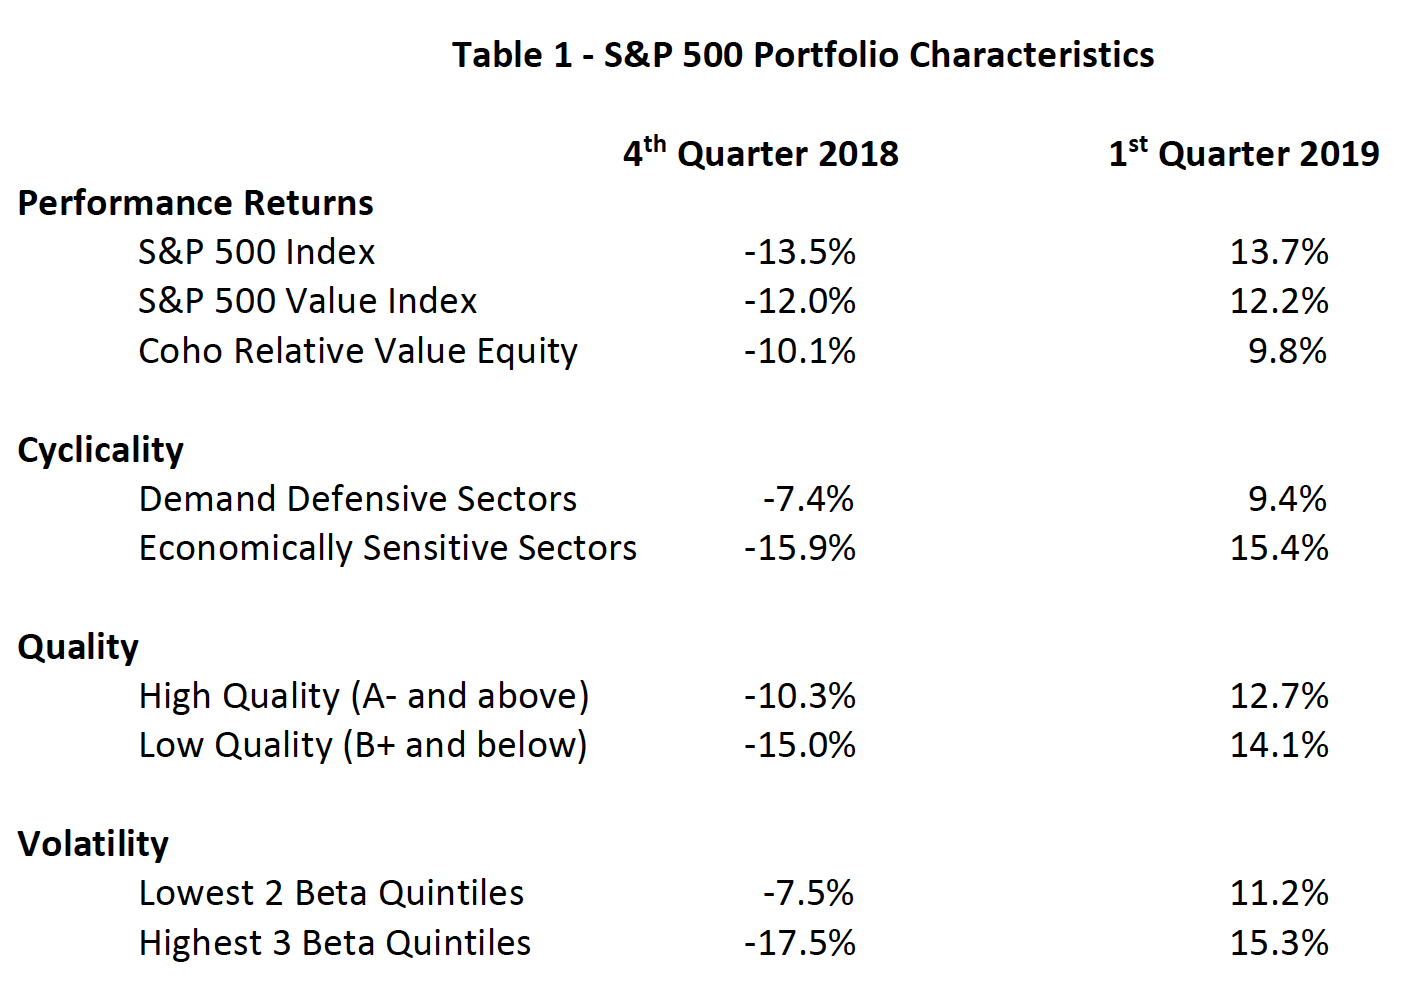
U.S. equity markets rebounded strongly from the weak fourth quarter sell off. The S&P 500 and the S&P 500 Value indices both posted double-digit gains. The broader averages have now essentially recovered all the losses seen in the fourth quarter of 2018. Growth once again outperformed value and the quarter had a bias toward risk as cyclicality, lower quality, and higher-beta companies did best. This was almost a complete equal and opposite reaction to fourth quarter 2018 performance, as shown in Table 1.
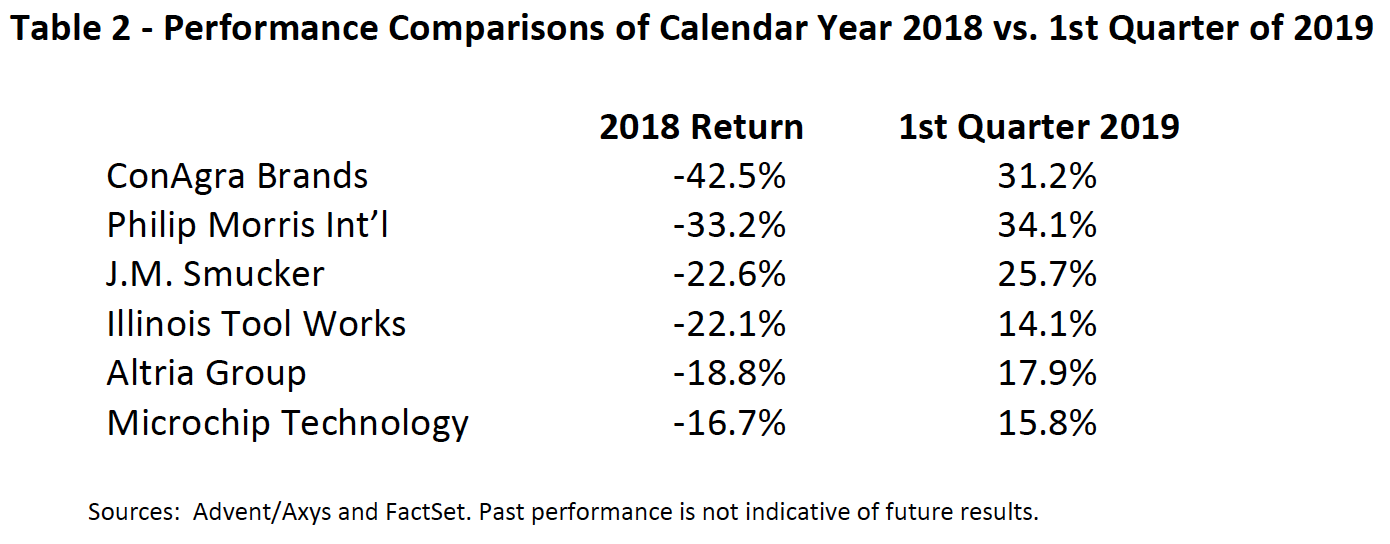
Some of our better performers this quarter were some of our larger detractors in 2018. Table 2 below compares performance for a number of our holdings that have been in the portfolio since the beginning of 2018.
We are pleased with the recoveries in many of our Consumer Staples holdings, which we have affectionately dubbed “the revenge of the nerds.” This sector has been under pressure for some time which possibly related to the disruption caused by some companies adopting “zero-based budgeting.” This strategy required companies to hold costs flat against the inevitable pressure of inflationary costs. The problem with such a strategy is that investment in innovation tends to fall commensurately, which ultimately compromises brand equity and leads to little to no top line growth. Without innovation, new competitors are incented to enter certain categories with new and fresh products that attract consumer attention. To offset the lack of organic growth, many Consumer Staples companies did deals to add new or adjacent categories to their portfolio, but this drained their financial flexibility, which ultimately led to several high-profile dividend reductions, such as those seen in Kraft Heinz and AB/Inbev. There has been deal activity within our Consumer Staples holdings as well, but we believe these managements never took their eye off innovation and marketing support for their brands.
Our Health Care holdings were generally weak this quarter as renewed concerns regarding a single-payer government system led investors to reduce exposure in this area. Our position remains that the U.S. will not adopt this system of health-care reform and as such, we maintain our confidence and conviction for our holdings. Additionally, we believe our companies excel either as innovators which keeps their products relevant to consumer needs, or they can demonstrate clear evidence that their services reduce overall health-care costs. We do recognize that, similar to the mid-terms and last Presidential election, price volatility for this sector will likely increase. As long-term investors, we are willing to accept that risk for what we feel are strong expected risk-adjusted returns.
If you have questions or concerns about our outlook or the portfolio’s positioning, please do not hesitate to call us. We look forward to updating you on the progress of the portfolio as the year progresses.
Sincerely,
Coho Partners’ Research Team
The views, opinions, and content presented are for informational purposes only. They are not intended to reflect a current or past recommendation; investment, legal, tax, or accounting advice of any kind; or a solicitation of an offer to buy or sell any securities or investment services. Nothing presented should be considered to be an offer to provide any Coho product or service in any jurisdiction that would be unlawful under the securities laws of that jurisdiction. Past performance is no guarantee of future results. There can be no assurance that the portfolio will be successful in limiting volatility.
