Second Quarter 2019
“We believe we are well positioned to participate in any advance while also providing downside protection should the market weaken further.”
June was an exceptional month for domestic equity returns with the S&P 500 Index advancing 7.1% and the S&P 500 Value Index rising 8.1%. This monthly return erased the negative returns of April and May resulting in the S&P 500 Index and S&P 500 Value Index advancing by 4.3% and 4.0% for the quarter, respectively. Year-to-date returns now stand at 18.5% for the S&P 500 Index and 16.7% for the S&P 500 Value Index. The return for the Coho Relative Value Equity portfolio this month was about 4.7%, our quarter was essentially flat, and year-to-date we are up about 9.6%. The year-to-date performance of the S&P 500 Index is the best first half return for the index since 1997 and if the second half were equally as strong, the market would be up over 40% for the full year. Our disciplined process and philosophy struggle to keep pace in periods of such robust market appreciation and our returns have significantly lagged the benchmarks so far this year. We attempt to address the reason for this disparity below.
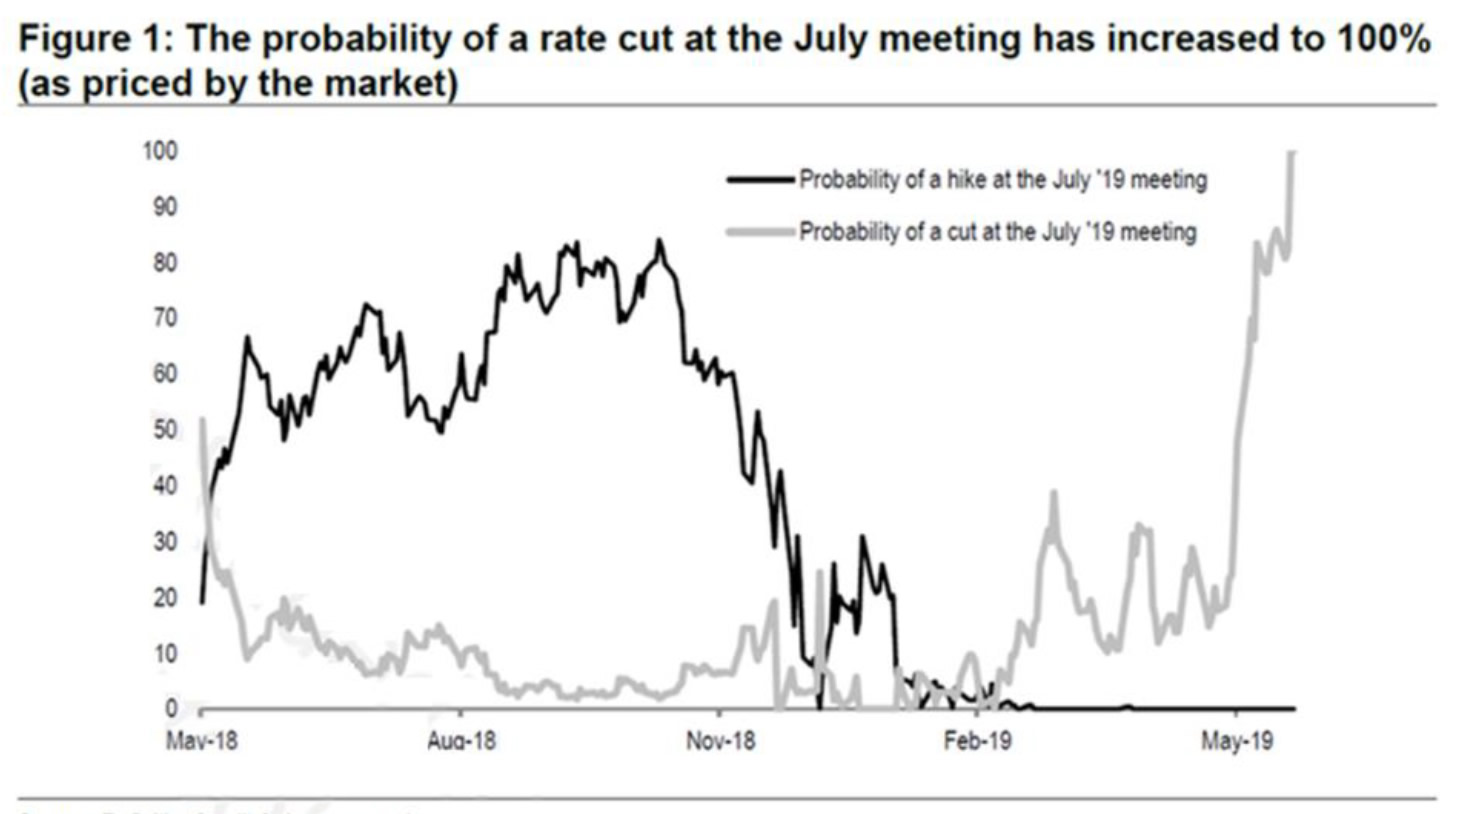
Why is the market up so much so quickly? We believe the market’s striking first half rise is due to a reduction in long-term prospective inflation expectations resulting in 1) lower global interest rates, 2) continuing to force investors into riskier assets (20% of the global government bond market is now yielding 0% or less), 3) the Fed changing its stance from tightening to accommodative (Chart 1), 4) pushing P/Es back into expansionary mode on top of, 5) modestly increasing earnings growth, and 6) a snap back from a sharp 4Q 2018 correction that seems overwrought in hindsight.
Why is Coho lagging by so much? We seek to generate a distinct pattern of returns that provides downside protection and upside participation through purposeful portfolio construction and a disciplined approach to valuation. Over a market cycle, we believe this is the best way to provide outperformance with a lower level of volatility. Given our investment process, we tend to lag in rapidly rising markets that are typically driven by cyclicality, beta, and momentum. We spoke to these headwinds in our letters for much of last year when our performance trailed in a similar fashion through the first three quarters of 2018. The market correction in the fourth quarter demonstrated the portfolio’s downside protection and allowed us to ultimately finish ahead of the benchmarks for the full year. Thus far in 2019, our lagging performance is singing a similar refrain. We fully appreciate our commentary may be starting to sound like a broken record, but we are now in a period where indeed records are being broken.
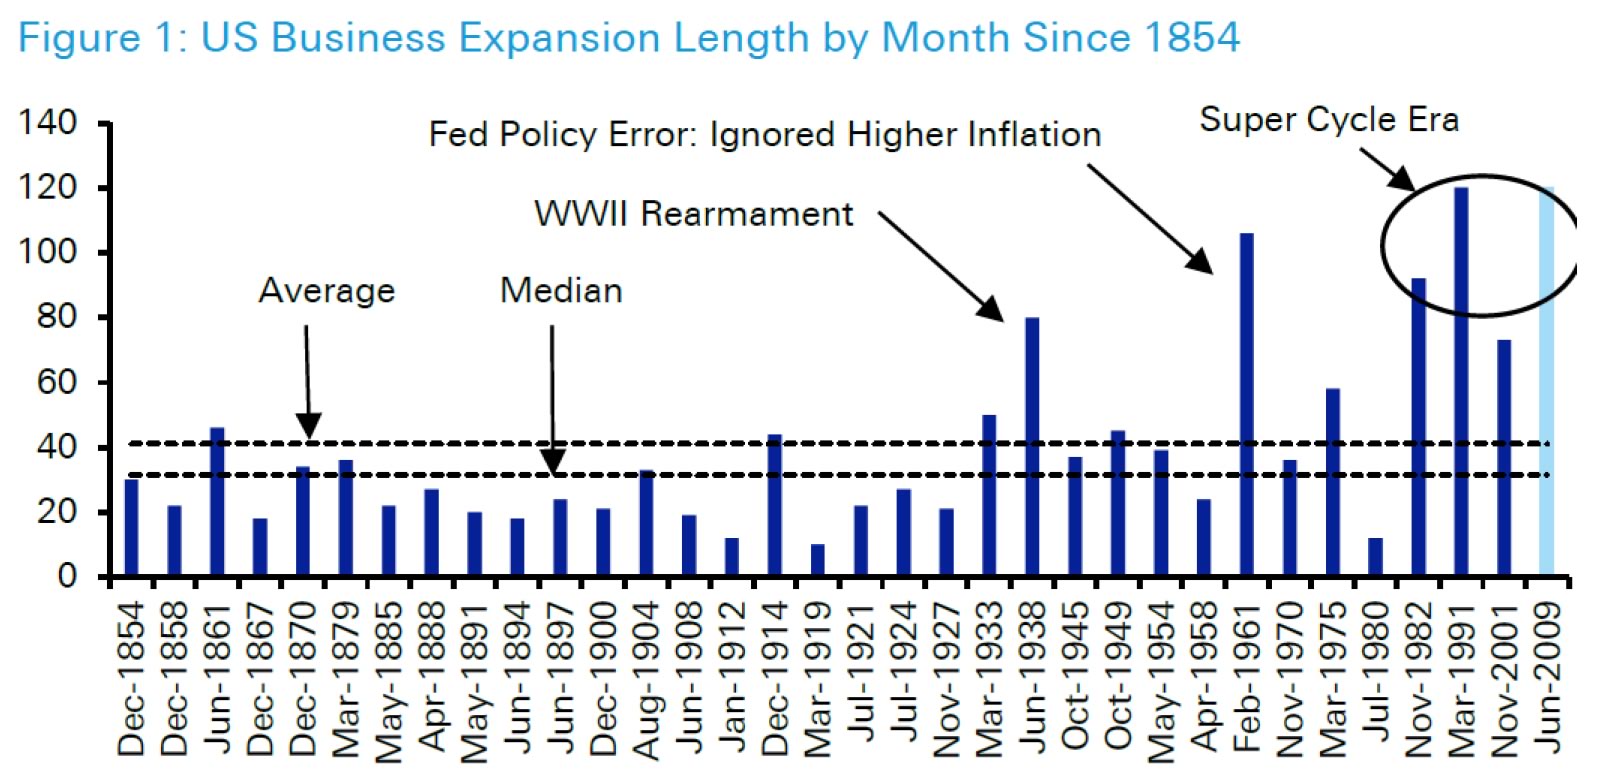
Underlying market dynamics are pushing historic extremes. The economic cycle has just reached a milestone for the longest expansion in history at 121 months. The amount of S&P 500 Index market cap devoted to cyclical sectors continues to hit new highs as cyclical stocks outperform, growth investing is on a record tear in dramatically outperforming value, the market has gotten more striated with the “haves” valuations at record disparities relative to “have-nots”, and higher beta stocks continue to easily best lower beta securities.
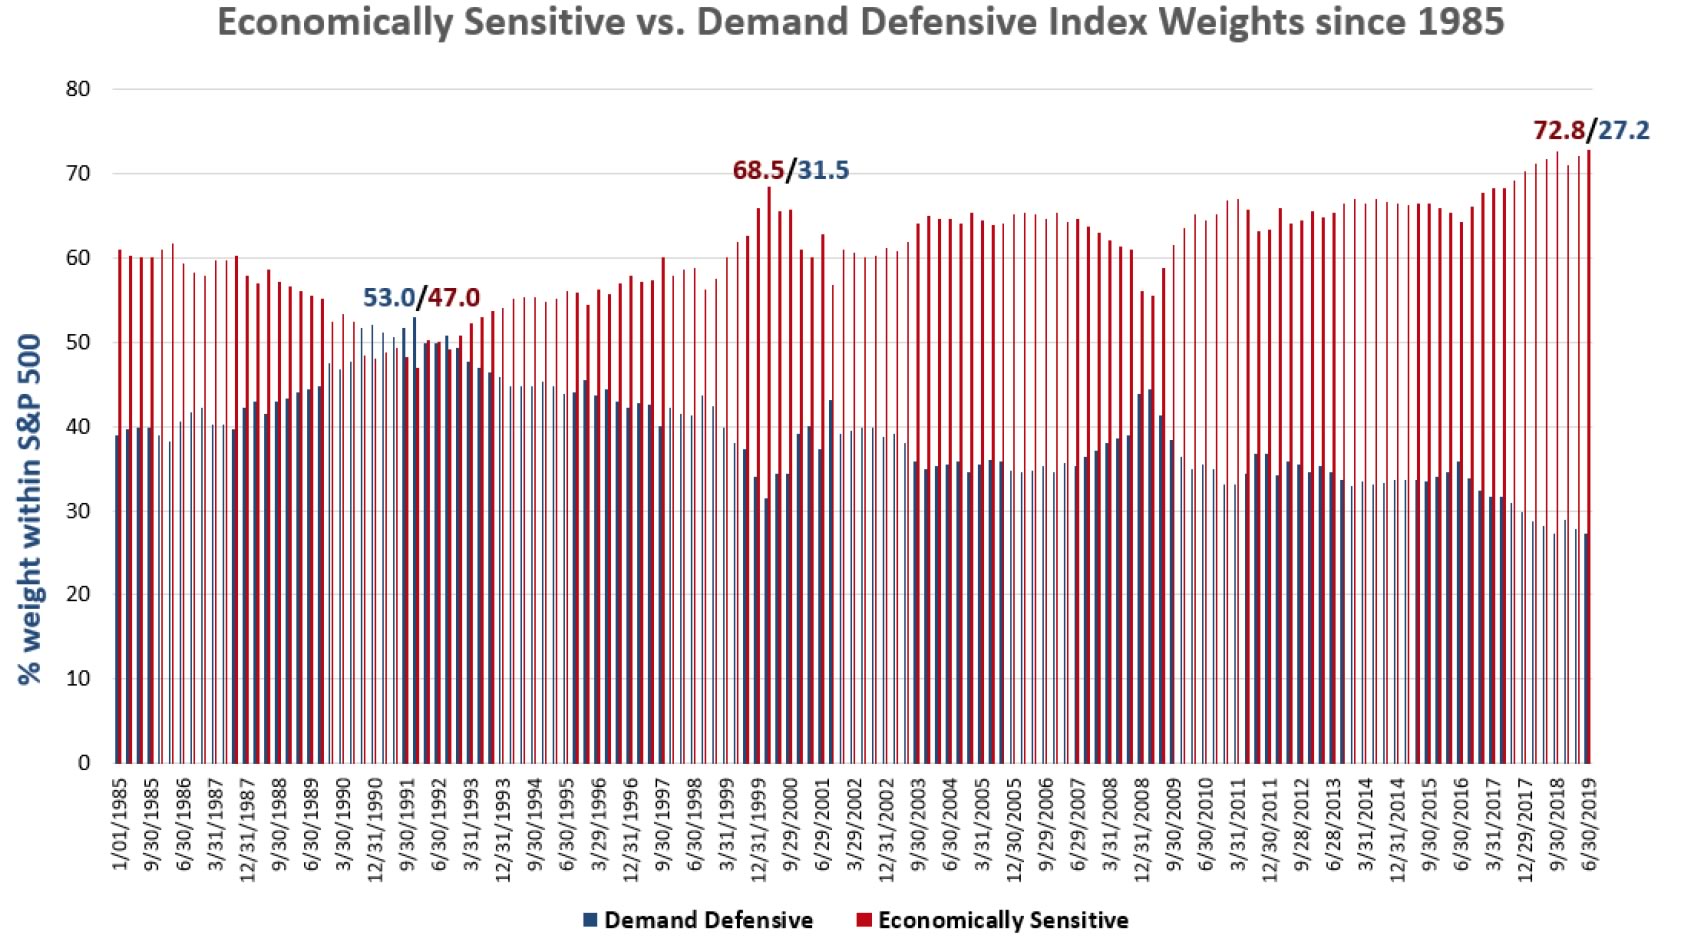
The length of domestic economic expansions has increased in recent decades (Chart 2), but we are somewhat concerned that now, 10 years into an expansion, the market has simultaneously placed a record weight on the more cyclical sectors (see Chart 3). The risks from here to continued stock market performance would be either 1) the duration in economic cycles has not permanently changed and there will be some sort of reversion to the mean, 2) even with secularly longer expansions, this particular cycle is aging, or 3) the cycle has indeed been extended, but the market has already fully priced that in (and perhaps more) by the valuations placed on cyclical stocks/sectors, or worse, all of the above. Given the record length of this cycle and the record peaks in cyclical sector weights, we feel more comfortable leaning the other way.
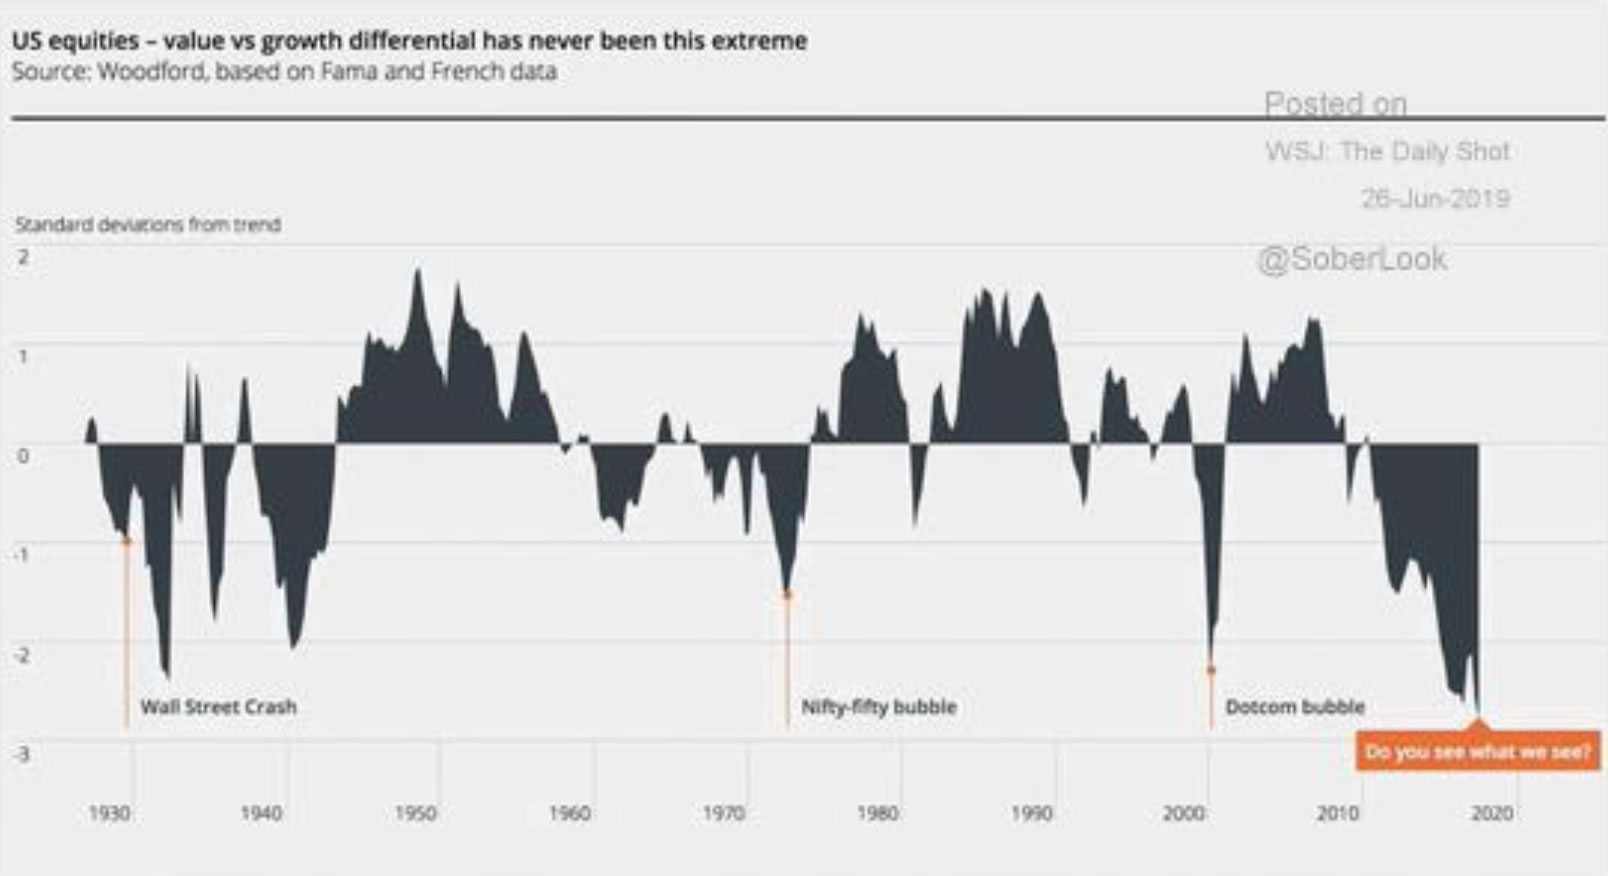
Growth vs. value has been another steady headwind for us. Valuation plays a large part in our process, providing downside protection against paying for expectations that are too high, and leaving room for upside if fundamentals come through better than expected. As seen in Chart 4, we have been in a record period of over 10 years of strong relative returns for the growth style of investing, which tends to pay much less attention to valuation and put much more weight on future growth prospects. While we seek long-term earnings growth equal to or slightly better than the indices for our holdings, we make sure it is within the context of reasonable valuations to help ensure we can protect principal when markets reverse.
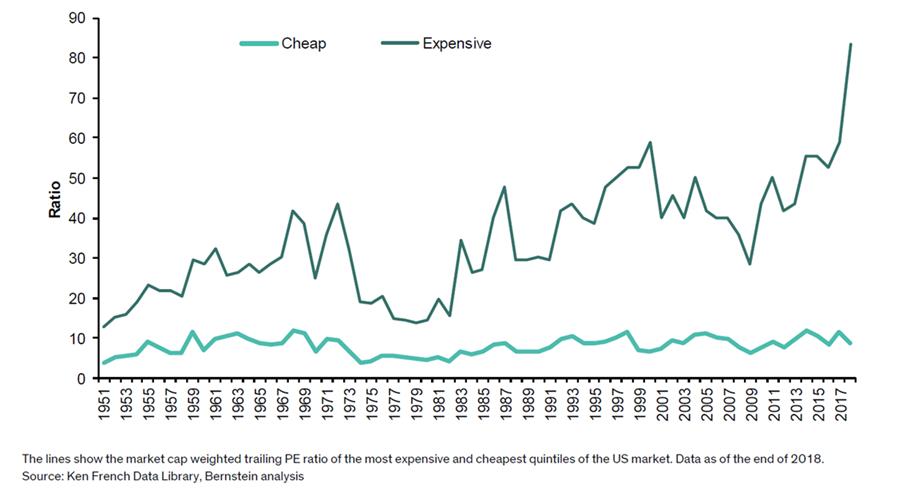
In another example of extremes, Chart 5 shows the market capitalization weighted trailing P/E ratios of the most expensive and cheapest quintiles of the U.S. equity market over time. The differential between the “cheap” and “expensive” quintiles is at an all-time high and has recently gone parabolic. There should be a gap between the valuations of the highest growth/quality stocks vs. the least, but unless the high growth stocks can continue their growth premium forever or the lowest quintile are going bust, there should also be a limit. Coho Partners has a number of holdings with trailing and prospective P/E multiples around 10x or less. Our valuation work suggests that the low P/E companies we own are some of the more attractive risk-adjusted holdings, yet they have been detractors to performance year-to-date. We believe the current P/E multiples for these companies too deeply discounts their prospective earnings and dividend growth potential. Earnings ultimately set prices, but the multiple one pays for the earnings growth is critical to future returns. Changes in P/Es typically drive outsized returns, so when the P/E multiple is expanding, prices can rise rapidly and when P/E multiples compress, prices can fall rapidly. If our “cheap companies” can continue to drive reasonable earnings growth, and they have, we believe valuations should expand, perhaps by quite a bit.
This look at the market’s extremes is not at all meant to overlook some of our more difficult stock holdings for this quarter and year-to-date, which in a concentrated portfolio, can have an outsized impact. Several have continued to struggle, although we have seen some encouraging green shoots. Kroger continues to push through its investment year behind its Restock Kroger program with mixed success and slower improvement than we would have liked. But we do see progress and we recently got a nice vote of confidence from the Board/management in their raising the dividend by 12% this month. State Street, while still integrating the Charles River acquisition and battling overall fee compression, also put through an 11% dividend increase and announced it will be buying back approximately 10% of its shares outstanding over the next 12 months. This was another strong vote of confidence by a management team we respect. We also like Lowe’s new leadership and its plan to increase margins and feel good about that company’s recently announced 14% dividend increase. While there is execution work to be done with these companies, and we remain highly focused on the execution marks on their position papers, we believe double-digit dividend increases and robust share repurchase plans like these are good signaling tools to demonstrate management teams’ confidence in their long-term fundamental strength.
In summary, our underperformance so far this year has been due to a combination of the underlying trends in the market that we have been noting for the past several years getting even more extreme, in addition to several of our holdings underperforming recently. While we are not predicting an imminent end to either this cycle or a change in the current underlying market trends, we are comfortable with our more conservative and defensive portfolio positioning. We really like our undervalued, out-of-favor stocks vs. the market as a whole. As a manager whose primary focus is on downside protection, we have been leaning appropriately into these steady and forceful headwinds and remain confident that we have a portfolio that should preserve principal should the markets correct. As disappointing as our upside capture has been so far this year, we also like the portfolio’s long-term growth characteristics and future potential returns. True long-term investing is not a sprint, but rather a marathon and we believe we are invested in business models that are well positioned to grow and prosper over time.
If you have questions or concerns about our outlook or the portfolio’s positioning, please do not hesitate to call us. We look forward to updating you on the progress of the portfolio as the year progresses.
Sincerely,
Coho Partners’ Research Team
The views, opinions, and content presented are for informational purposes only. They are not intended to reflect a current or past recommendation; investment, legal, tax, or accounting advice of any kind; or a solicitation of an offer to buy or sell any securities or investment services. Nothing presented should be considered to be an offer to provide any Coho product or service in any jurisdiction that would be unlawful under the securities laws of that jurisdiction. Past performance is no guarantee of future results. There can be no assurance that the portfolio will be successful in limiting volatility.
