First Quarter 2018
“The provision of liquidity alone can by no means solve the problems of credit risk and credit losses; but it can reduce liquidity premiums, help restore the confidence of investors, and thus promote stability.”
– Ben Bernanke
The global economy has continued a slow-but-steady advance in 1Q as economic growth around the world has broadly remained solid. We would not characterize this level of growth, however, as anything more than a return to trend following a softening of output between mid-2015 and early 2017. Global export volumes and industrial production have strengthened relative to that soft patch, but recently, we have witnessed a slowing of momentum starting in 4Q that has continued into the opening quarter of the new year following real global growth of 3.6% in 2017.
With the major developed economies of the United States and the Eurozone paving the way, industrial production is now growing at the fastest year-over-year (y/y) pace since 2011. In the U.S., a continuing weaker dollar along with more stable commodity prices and a solid global backdrop have continued to engender optimism when combined with the fiscal initiatives of the Trump administration. The recently enacted tax package has begun to provide a boost to after-tax incomes for consumers and businesses and has been evident in the recently released consumer data along with estimates for corporate earnings growth that analysts expect to be the strongest in over four years. It is hoped that the second fiscal jolt tied to the spending side of the budget should also begin to take effect next quarter, providing another boost to domestic demand. It is this critical component of the economy that gives us pause.
While the supply side of the economy has benefitted from recent tax law changes and decreasing regulation, we are late in the economic cycle with a consumer that increasingly appears exhausted and running on the fumes of a multi-year debt binge and decline in savings. At the same time, we are undergoing a major global regime change as years of ultra-accommodative monetary policy is slowly reversing. We have noted for the better part of the last decade that our economy remains too highly indebted and dependent on artificially low interest rates. With the Federal Reserve having already raised interest rates six times in just over two years and poised for another 2-3 more hikes in 2018, monetary policy and fiscal policy are now working against one another. This will likely have the effect of negating much of the benefit of fiscal stimulus that on its own might move the Fed to accelerate rate increases at a pace quicker than the market is anticipating. While the fear of trade wars makes the headlines as the major cause for market turmoil, we believe this reversal of monetary policy to be a more impactful issue.
Following nearly a decade of quantitative easing, the normalization process (quantitative tightening) of the Fed calls for allowing increasing amounts of mortgage and Treasury debt to mature without being reinvested. Overall, the Fed anticipates paring the balance sheet from the current nearly $4.5T to $2.5T-$3.0T over the next few years. In the final quarter of 2017, the Federal Reserve was allowing $30B of assets to roll off, a number that was increased in 1Q 2018 to $60B. We are now entering a period in the second quarter where this amount will increase to $90B. A balance sheet that had increased five-fold in a decade is now reversing. Combined with one of the most aggressive fiscal initiatives in years, this implies that The Fed intends to stop buying bonds at the very time the US Treasury will issue more bonds to fund a growing budget deficit. It is estimated that the Treasury Department will need to borrow over $900B this year almost double the amount borrowed in 2017. The concern is from where the buyers will come which would be compounded if our escalating tariff war moves China (our largest holder of treasuries behind the Fed) away from the table. This borrowing is also not a one-time need. Most reports also forecast deficits to exceed $1.25T in the following five years about double the prior five. On a global basis, this is coming at a time when the European Central Bank is also undergoing a 50% reduction in their quantitative easing with Japan also curtailing their bond purchases.
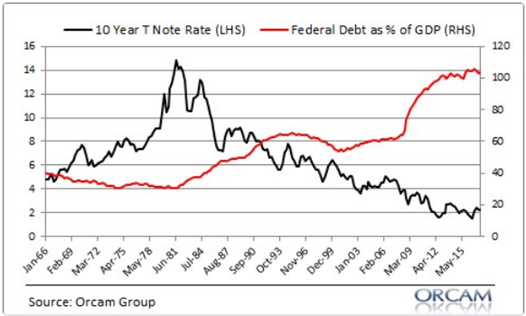
Though interest rates have declined during a period of increasing Federal Debt to GDP ratios (see chart below), we fear the incredible amount of supply needed to fund these deficits may overwhelm demand leading to higher rates. The impact on the budget of the Fed will be pronounced and in the most recent monthly report, February interest expense rose to $23.3B, an increase of 10% y/y. Interest expense now represents 6.3% of spending vs 5.8% last year.
In addition to rates rising at the national level, Corporate America is now paying the most in nearly a decade for some types of short-term borrowing, another potential threat to a long-running U.S. economic expansion and a potential driver of increasingly volatile markets.
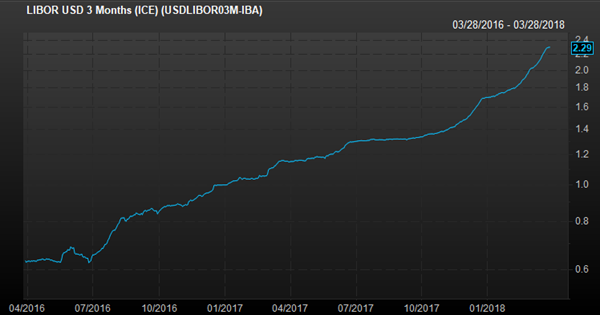
The London Inter-Bank Offered Rate, commonly referred to as Libor, measures the cost for banks to lend to one another and is used to set interest rates on over $300 trillion in dollar-based financial contracts globally, from corporate loans to home mortgages. Recently, Libor climbed to 2.33% in the U.S., its highest since November 2008. Over $1.2 trillion of consumer mortgages and other forms of consumer debt such as student loans are pegged to Libor.
Libor has been rising for the last two years as the Fed has lifted the Federal Funds rate, but recently these increases have accelerated (see chart below) rising over 1% in just six months.
Though part of Libor’s recent surge appears to have been driven by technical factors partly related to the new tax law, the cost of short-term financing is going up and pressures are starting to show up in the corporate bond market where spreads have also been rising. These increases, coming at a time when the global central banks are already tightening policy, may intensify this impact and further stifle liquidity throughout the financial system.
From mid-year 2015 through the first quarter of 2017, the U.S. economy slowed further from the already tepid 2.2% (a/r) of GDP growth achieved since the depths of the recession. The seven-quarter period generated a near stall speed rate of growth of only 1.5% a/r with slowing consumer spending the major factor. Consumer spending accounts for nearly 70% of our GDP calculation and slowed demonstrably from a 3.5% pace in 2014-2015 to a 2.7% a/r during the period noted.
The last three-quarters of economic output have averaged 3.0%, marking the strongest period for successive growth since early in 2015. Consumer spending has rebounded during this period to a level of 3.1%, though still below prior levels. We had noted during our 3Q Commentary from last year about the noise around the data that would characterize the subsequent three-quarter period following the devastating hurricanes of Harvey and Irma. With a massive rebuild that was most needed in the areas of housing and autos, a challenge was to separate the noise from the trend. It seems to us that much of this distortion has been academically understood but perhaps not distinguished from the prior or subsequent trends.
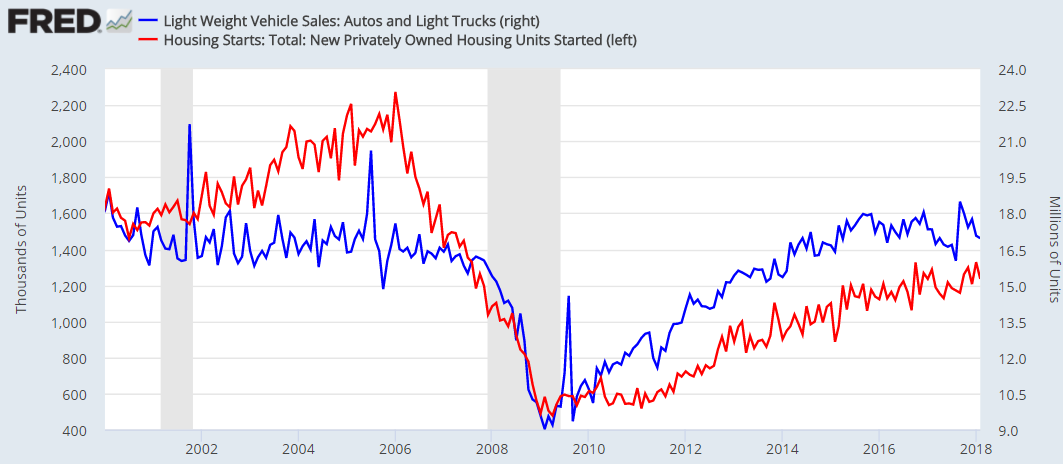
Large durable purchases on housing and autos have been a critical component of spending growth during this economic expansion. We have noted the softening in auto demand for more than two years but now the contributions from the housing sector appear to be slowing as well as shown in the chart below. The blue line represents auto sales and one can clearly see the slowdown from late 2015 and accelerating decline into mid-2017 followed by a marked increase for multiple months during the rebuild. A similar but less pronounced moderation is also seen in the red line representing new housing starts.
Strong consumption of 4.0% was the primary driver leading 4Q GDP growth to a 2.9% a/r and alone contributed about 2.8% to overall economic growth. It must be noted that the consumer gorged on credit card debt during the quarter, increasing the level of borrowing by $25B while simultaneously reducing the savings rate towards 2.5%. As expected incoming data from the first few months of 2018 suggest personal consumption expenditure (PCE) growth slowed in 1Q. This was expected as wage growth has continued to lag such strong spending gains. It is usually a positive reflection on consumer confidence in the underlying economy that consumers chose to borrow from future tax savings and income growth and consumer confidence figures at cycle highs reflect this. However, we are now anticipating that consumer spending will slow in 1Q to a pace around 1.5%, as it digests the heavy spending of the prior period.
Much of this consumer confidence emanates from continued, and even accelerating, job growth into 2018. For all of 2017, payroll growth averaged over 180K per month, and we anticipated a tightening labor force would slow that pace. Instead, trends over the last three months have increased, contradicting our view. While monetary policy was the only game in town for a few years, the recent moves on deregulation and tax reform are strongly encouraging both the supply of labor and the demand for labor and may finally be bringing many who had left the workforce back into the game. Strong gains in employment have continued to reduce the unemployment rate to 4.1%, but wage growth has remained constrained and is needed to support further increases in consumption.
The U.S. dollar has declined about 13% since the beginning of 2017. By reducing the foreign-currency price of U.S. goods and services, a weaker dollar should continue to help boost American exports. However, U.S. export growth is much more sensitive to changes in foreign economic growth than it is to changes in the real exchange rate, and U.S. manufacturing has benefitted from the synchronized global expansion. A modest softening in that rate of growth will slow the contribution of trade in this quarter.
Despite a soft opening quarter to the new year in which we expect GDP may come in below 2%, we are still expecting a solid year of growth between 2.5%-2.75%. Much as with 2017, however, we continue to be mindful that the fiscal stimulus may continue to overstate the actual underlying growth of the economy as replacement demand from the hurricanes hands the baton to tax cuts. We need to see organic growth in consumer wages to maintain confidence in the continuation of the recent trend.
TARIFFS:
As U.S. workers have faced the obsolescence of many jobs and globalization has moved others overseas, trade policy became a key political issue for President Donald Trump. One of President Trump’s most aggressive promises on the campaign trail was to avenge China’s “rape” of our economy and theft of critical manufacturing jobs. During his first year in office little was heard on this issue and even the position on blacklisting China as a currency manipulator was reversed with no major tariffs issued. Clearly, that silence is over.
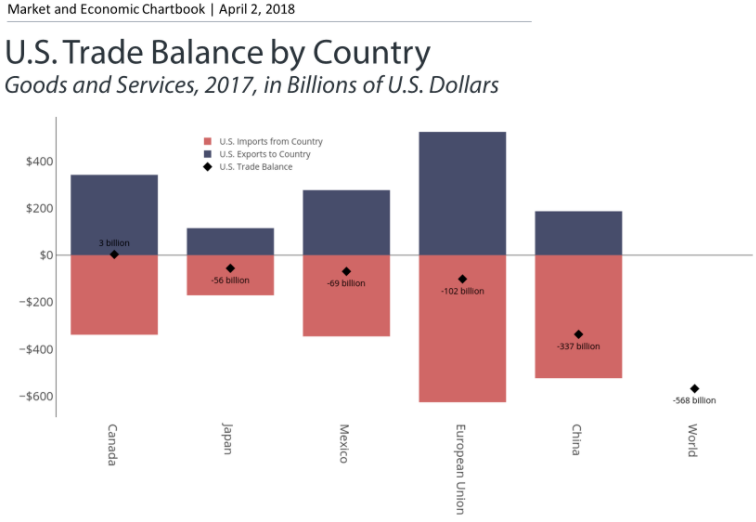
The chart below from Clearnomics shows the trade balance of goods and services with our five largest trading partners. The diamonds in the middle of the bar depict the actual balances. While the trade deficit of $337B with China makes it an obvious target, the row is more about China’s predatory practices requiring U.S. businesses doing business with China to transfer valuable technology to the country’s local firms while simultaneously restricting access to their markets. This theft of our intellectual property is at the heart of the current trade spats causing the markets to spasm.
Global trade should create positive contributions to economic growth, employment gains and reduced prices on goods. Both the U.S. and China have strong incentives to negotiate solutions and we are optimistic that President Trump may be shaking up the history of trade relations between China and the U.S. for the purpose of better negotiations. Still, tariffs translate directly into higher prices for consumers and reduced employment in the affected industries. They also impact the confidence of business leaders, consumers and market participants.
There is a recent history lesson here. In 2002, President George W. Bush imposed steel tariffs of 8% to 30%. Estimates from economists suggest that the resulting higher steel prices led to 200,000 lost jobs and $4 billion in lost wages from February to November of 2002. In response, the EU threatened to impose $2.2 billion in tariffs against the United States. The tariffs were withdrawn two years later. This backlash is among the reasons that every living former chairman of the president’s Council of Economic Advisers signed a letter last year urging Trump not to impose tariffs.
Clearly, a potential trade war between the world’s two largest economies looks frightening on the surface, and it is unprecedented in modern times. Yet, in many ways, the current relationship between the U.S. and China needs to be disrupted as the Chinese theft of our intellectual property curtails our innovation and therefore much of the potential growth of our economy.
Despite the recent back and forth threats on the imposition of tariffs between China and the U.S., we remain optimistic that a deal will be struck on the issues of intellectual property. In the meantime, buckle up.
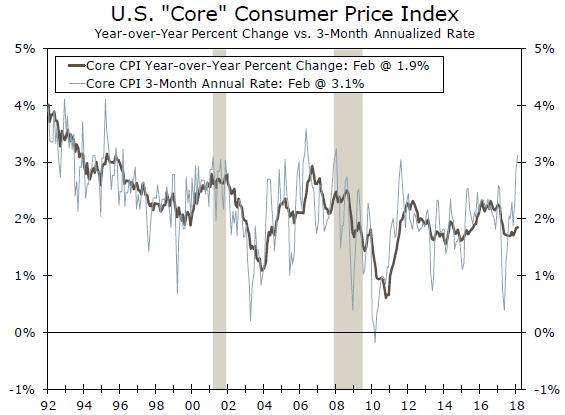
We continue to note the critical impact of inflation on our economy in 2018, and its importance in Fed policy, wages and market valuations. There is little doubt that cyclical price pressures continue to escalate throughout the system. The most recent reading on CPI inflation shows the year-over-year rate steady at 2.2% with the “core” CPI (excluding food & energy) also flat at 1.9%. Both mask the clear underlying trend.
Even with February’s more modest print, over the past three months, headline inflation has risen at a 3.6% annualized rate (a/r) —the fastest of this expansion. More importantly, the core index now exhibits a 3.1% 3-month a/r that has accelerated from 1.9% in November. The charts below from Wells Fargo show this acceleration which we expect to continue through 2Q as we anniversary low inflation readings.

While many view the financial crisis as the primary cause for the slowdown in inflation during the economic recovery and therefore cyclical, we continue to view overwhelming secular trends as dominant and unlikely to reverse in the future. The predominant trends are demographics, debt and rapidly advancing technologies.
An aging population combined with slowing overall population growth reduces aggregate demand. Excess debt, exemplified by median income relative to liabilities near historic lows, reduces the potential increase in the money supply as borrowing cannot expand substantially as more and more of household income is directed towards existing debt paydown. Technological innovations continue to reduce labor and manufacturing costs. These trends are clear and should place a ceiling on the level of price pressures we can expect this cycle.
2018 will likely mark a dramatic shift in global monetary policy that may trump the changes on the fiscal front as the prior ten years of financial tailwinds give way to increasing headwinds.
Janet Yellen’s last meeting as Fed Chairperson in December marked the fifth increase in the federal funds rate (now 1.25%-1.50%) since the end of 2015. That there was little market response indicates a collective view that the new head of the FOMC in the new year will maintain the measured pace of rate increases of the past few years. The consensus view of economists is for an additional two to three rate hikes in the new year.
New Federal Reserve Chairman Jerome Powell replaced the outgoing Janet Yellen during the first quarter amidst a plethora of deficit expanding fiscal stimuli. Though the Trump administration’s proposed infrastructure plan will face many hurdles in an election year, it would still follow the Republican-led Tax Cuts and Jobs Act passed in December, which is estimated to deliver $1.5 trillion in tax cuts over the next decade. Additionally, the new two-year budget deal is slated to raise Federal spending by almost $300 billion. Interest payments of $420 billion on the nation’s debt will push the deficit above $2 trillion (the current budget deficit is $440 billion), according to the Committee for a Responsible Budget.
Many in the market postulate that Chairman Powell will have the same level of support for the capital markets as his predecessors and err on the dovish side. We fear that the Federal Reserve may have to step on the gas in raising interest rates just to counter all this fiscal stimulus and issuance of new debt and are anticipating at least two more increases for the balance of the year.
Though the payroll report for March was clearly below recent levels and expectations, one needs to look more at the trend of job creation which has clearly surprised to the upside this late in the economic cycle. The 3-month average of job growth is 202K, a level that exceeds the 12-month average of 188K and highlights the acceleration we have enjoyed. These strong gains in employment continue to translate into declines in the jobless rate, which stands at 4.1%.
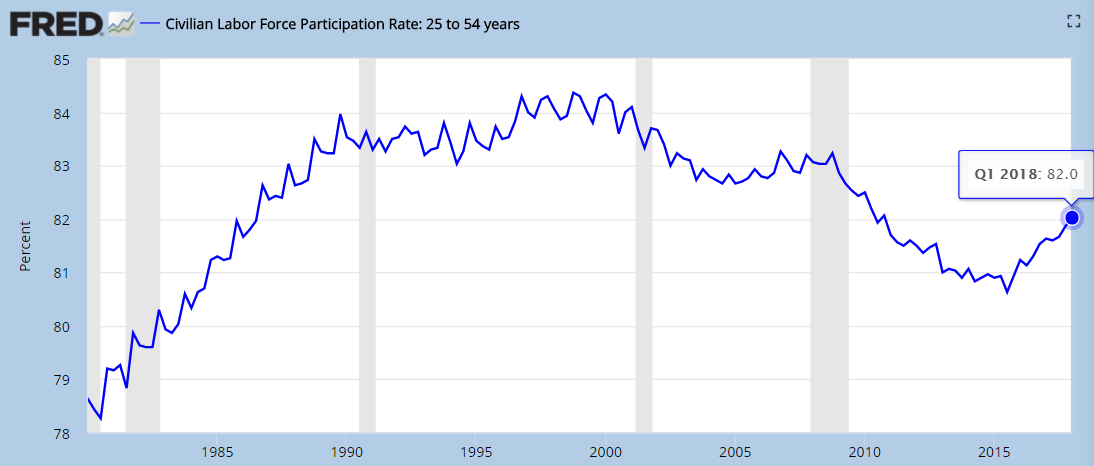
One of the main reasons former Federal Reserve Chairman Janet Yellen expressed for the continuation of easy monetary policy was that she always felt convinced that there existed excess labor market slack in the post-crisis economy. Low labor force participation rates were partly ephemeral in her view and, therefore, she felt little threat of wage or price pressures until this labor slack was reduced. Though total labor force participation has been little changed over the past four years due to an aging baby boomer cohort, there has been a critical offset in the resurgence of the participation rates of “prime-age” workers in the 25-54-year-old demographic.
Workers in their late 20s to early 50s have the highest levels of labor force participation. After reaching a low of 80.5% in July of 2015, participation of this group has risen steadily to the recent level of 82% (see chart below). With labor supply and productivity the underlying drivers of long-term economic growth and with population growth of this group at historic low levels, it is critical to increase the percentage of these workers participating in the labor force if we are to raise the economy’s potential rate of growth.
The rise in participation illustrates that many of the workers sidelined by the poor jobs market following the recession are beginning to come back to the labor market. Those that have viewed the tightness of the labor slack as purely a function of aging demographics must address the possibility that supply side moves on deregulation and tax reform may have engendered the surge in business and consumer confidence to both hire and expand and look for promising employment.
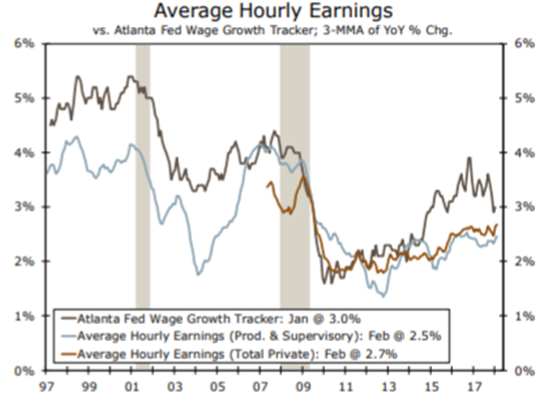
This expansion of the labor force may hold a partial explanation as to why the firming in the labor market has yet to translate into anything more than slow wage growth that has remained below market expectations (see chart below). Still the trends are positive, and we continue to expect a moderation in job creation with a commensurate slow rise in wages over the next few quarters.
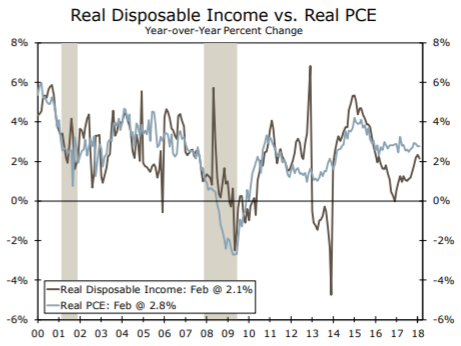
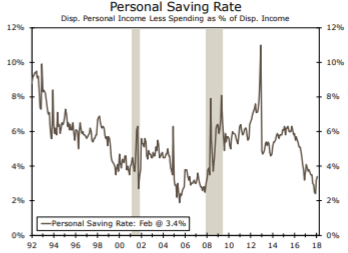
The final consumption figures for 4Q 2017 saw a breakneck pace of consumer spending (4.0% – the third fastest of the expansion) that we have noted was not sustainable and led by a whopping increase in total credit card debt of $25B during the quarter. Along with the continued drawdown of savings from a level of 6.1% in late 2015 to 2.4% at the end of 2017 (chart below right), we anticipated a spending hangover would take place in the early part of the new year. So far on data through February, consumer spending in the U.S. adjusted for inflation has fallen at an annualized rate of -1.3%, the weakest since 2009.
One can see on the chart below left that the consumer has been spending at a pace exceeding real disposable income for over two years. Indeed, with recent consumption figures having come in way below analyst estimates, it is now projected that overall personal consumption expenditures adjusted for inflation (real PCE) may be as low as 1.5% or less in the first quarter. This is despite the benefit of the recently enacted tax cut that has seen tax payments decline $55B during this period, a 15% annualized drop.
Perhaps the biggest risk facing consumers is higher inflation with the potential to erode purchasing power. With core inflation rising at a 3.1% a/r over the most recent quarter and the consumer already having drawn down savings and tapped credit to maintain consumption levels, we highlight this as being among our largest concerns moving into the Spring. Still, we look for the impact of higher after-tax income from the recent tax cuts along with delayed tax refunds to lift spending modestly into mid-year.
In addition to quiescent wage growth, the additional debt capacity of consumers will remain a longer-term headwind for future consumption. According to data from the New York Federal Reserve, aggregate household debt balances at the end of 2017 exceeded the prior peak in 2008 by a whopping $473B while mortgage debt (the largest component) has modestly declined. Tightening lending standards by credit card and auto lenders have been a recent response to the early signs of rising defaults and delinquencies.
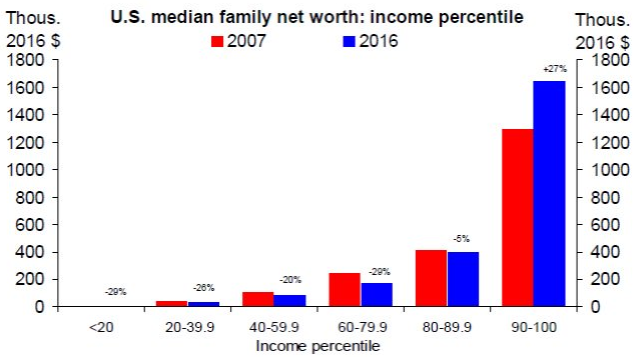
Years of quantitative easing and keeping rates pinned to the floor has clearly benefitted capital markets that have soared, and we also note the increases in aggregate household net worth. Aggregate household net worth peaked prior to the recession in 3Q 2007 at $67.6 trillion in total net assets. After declining to a trough level of $54.9 trillion in 1Q 2009 it has since skyrocketed to the most recent reading of $98.7 trillion at the end of 2017.
However, the aggregate data dramatically skews the tale of the information as it is the median family net worth that is more telling. As the chart below shows, this has been a great recovery if one is in the top decile of income groups. Every decile of income groups outside of the top has seen their net worth decline from 2007 and outside of the top two deciles, the decline has exceeded 20%! This clearly helps explain the loss of a sense of well-being in America despite economic improvements.
As noted in the opening sections, consumer spending on the large durable purchases of housing and autos have clearly slowed since the start of 2017 outside of the rebuild from hurricanes Harvey and Irma. On a population-adjusted basis, home construction remains near the lowest level in the 60 years of record-keeping despite a decade having passed since the housing bust (see chart below).
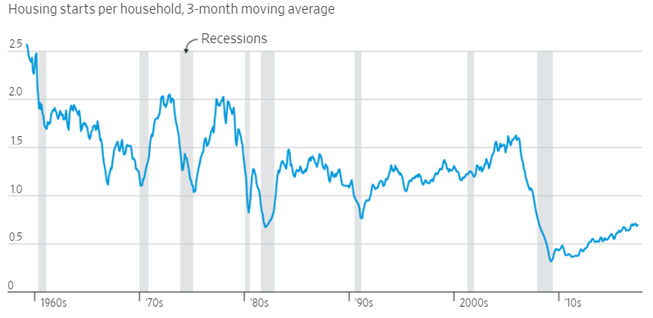
While we do hold some concern regarding consumer balance sheets, the slump is still somewhat puzzling on the surface as, by many measures, the American economy is doing well. Though Millennials are starting households much later than prior generations, they are now aging into home ownership at a time when job growth is very strong, wages are rising modestly, and stock market valuations remain near all-time highs. Demand for housing should be, and we believe, is a lot stronger than the starts and sales data indicate.
The National Association of Home Builders (NAHB) now estimates that we need about 1.3M new homes to equal population growth. Yet estimates are for fewer than 900K housing starts in 2018. The overall inventory of available homes for sale recently hit the lowest level on record in the fourth quarter. Why is this? Remnants of the housing bust are still prevalent as following the trough in housing revenues, municipalities increased fees and regulatory costs that now are estimated to add nearly $85,000 to the cost of a home, up more than 30% since 2011. Builders continue to site the lack of available lots along with rising material and supply costs. This is in addition to a far smaller pool of skilled labor due to immigration declines and the aging of the labor force with many leaving the industry during the downturn. It is just not profitable for builders to construct homes in the lower end price points that are most needed.
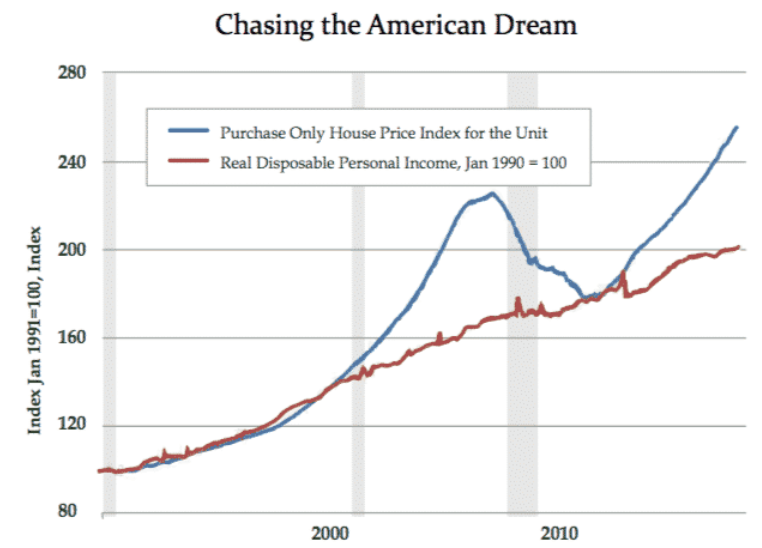
This lack of available homes in turn creates home price appreciation at a breakneck pace far exceeding wage growth over the last few years. The Case-Shiller National Home Price Index (the largest measure of national home prices) rose 6.3% in 2017 and has moved up slightly higher early in the new year. This is basically twice the rate of income growth and three times the rate of inflation over this period. So, although demand is increasing, affordability is hamstringing potential purchasers. As one can see in the chart below comparing increases in home prices to disposable personal income, housing prices are currently almost as overvalued versus incomes as during the boom of the prior decade. Into this affordability challenge, potential buyers now face the prospect of rising mortgage rates.
The average 30-year mortgage rate in the U.S. has risen to 4.44% as of the end of March from 3.78% just six months ago. For a $300K mortgage loan, this represents an increase in monthly payments of $118 or over $1400 per year. Though mortgage brokers will likely point out (correctly) that these are extremely low compared with historical averages, it is the marginal cost that impacts demand. With prices already rising, this is a double whammy for potential buyers.
According to auto data compiled by Experian, the final quarter of 2017 continued the concerning trend of rising consumer debt on new car loans. The average level of financing rose to $31,099 moving the average monthly cost to over $515. To even get this lower payment with rising loan rates, buyers needed to extend payment terms to a record 69 months. Carmakers that used 0% financing offers to juice sales at the height of the auto boom are starting to abandon them as rising interest rates lift their own borrowing costs, which, at 5.7%, are the highest since 2009.
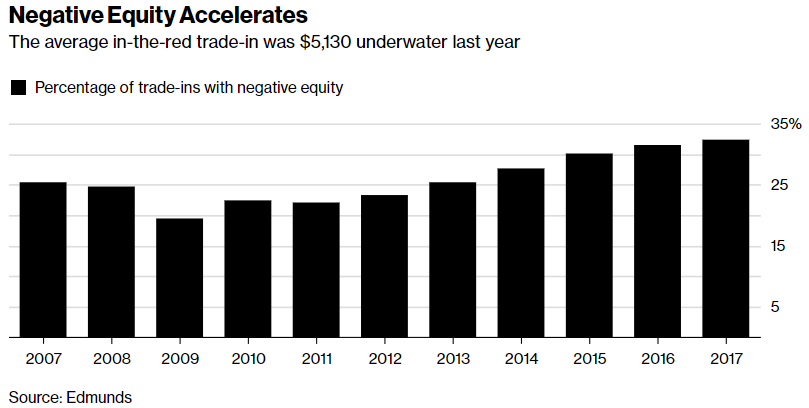
The extension of the duration of payments may seem innocuous but it has and will continue to actually create an upward bias to monthly payments. According to Edmunds, almost one-third of cars traded in last year were worth less than the loans outstanding with the average car being traded in underwater by $5,130 (chart on following page). The dealer sells the used car, and whatever balance remains on the old loan is folded into the new loan. The borrower then extends the length of the loan to help keep monthly payments manageable. More and more borrowers are getting deeper into car debt with every car purchased. Rising rates will only exacerbate this concern.
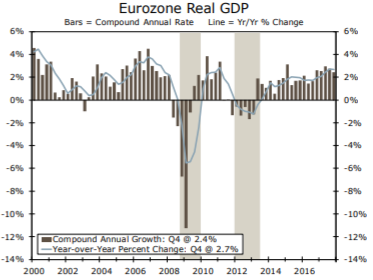
The economic expansion in the Eurozone continued in the final quarter with real GDP increasing 2.4% on an annualized basis and 2.5% for the full calendar year of 2017 versus 2016. Much of the growth was driven by continued improvement in fixed investment spending and international trade where exports grew 6.1% in 4Q year-over-year despite the strong euro. Although the economic data have been indicative of increasingly self-sustaining growth some early signs in the new year show a modest deceleration in economic output consistent with the pause that we have noted in most developed economies.
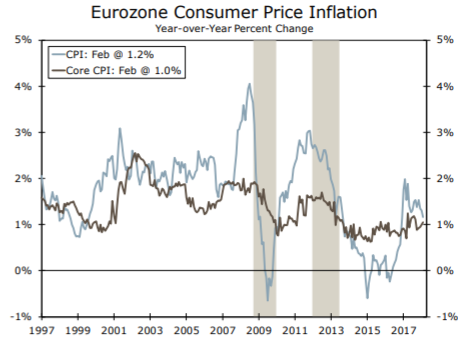
In this backdrop, inflation in the Eurozone remains benign. CPI inflation fell significantly from 2012-2015, causing the ECB to cut policy rates and implement a quantitative easing (QE) program. As seen on the chart below right, the efforts to reflate the economy have yet to be successful as headline inflation has dropped back from a post-crisis peak of 2% to the most recent reading for March of 1.4% with the core reading hovering around 1%. As inflation slowly begins to pick up and growth remains solid, the Governing Council is now tasked with ending its QE program and eventually beginning to hike rates. In the March meeting, the ECB removed the language of re-accelerating their bond-buying program if the economy were to turn down again taking another small step away from radical stimulus.
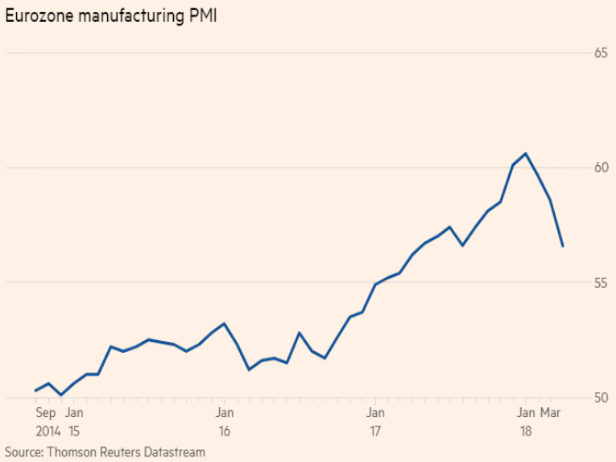
Though the ECB is showing increasing confidence in the sustainability of economic growth, early reads of much of the data in 1Q 2018 give pause. The purchasing mangers index (PMI) is an indicator of the economic health of the manufacturing sector based on major indicators of new orders, inventory levels, production, deliveries and employment. The March report highlighted the softening seen in the opening months of the quarter as seen in the chart on the next page. Unless the moderation were to accelerate, we look for the ECB to end the current €30B per month pace of asset purchases on September 30th and start to hike rates in the first half of 2019.
In early March, China approved a plan to abolish its two-term limit for presidents paving the way for Xi Jinping to remain in power indefinitely. Obvious concerns center around the return to the era of one-man rule at the same time China continues to increase its role in global politics and economics. The move seems to end the political norms that have governed Chinese politics that were put in place in the 1980s by Deng Xiaoping to prevent the dominance that his predecessor (Chairman Mao Zedong) maintained from 1949 until his death in 1976.
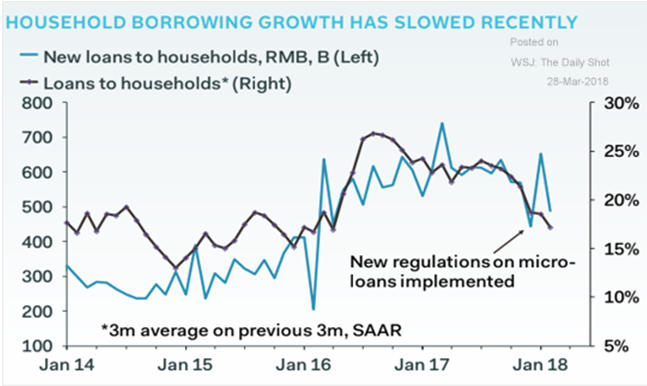
Positives, however, are found by some in how President Xi has continued to try to open markets and improve transparency. Obviously, many would disagree. What this does most certainly do is allow Xi to focus on longer-term initiatives. These include deleveraging, constraining asset bubbles and focusing on reducing credit growth even at the risk of a moderating economy that would be more challenging if he faced political opposition. As the chart below from Pantheon Macroeconomics shows, this targeted reduction in household leverage has been going on for almost two years while maintaining solid growth.
One of the largest challenges facing China appears to be the maturation of almost 70% of the outstanding $4T debt load by 2020. According to data from the Financial Times, companies and state-owned enterprises (SOE) have $409B of maturing bonds this year with an additional $619B in 2019 and $664B in 2020 that will need to be refinanced at what would appear to be higher rates. This will be a critical test and increases the likelihood of defaults for an economy that has already experienced more than 80 such defaults over the past two years.
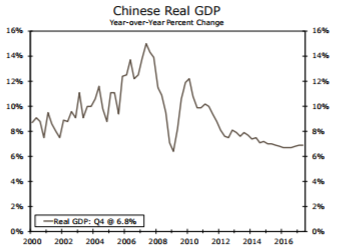
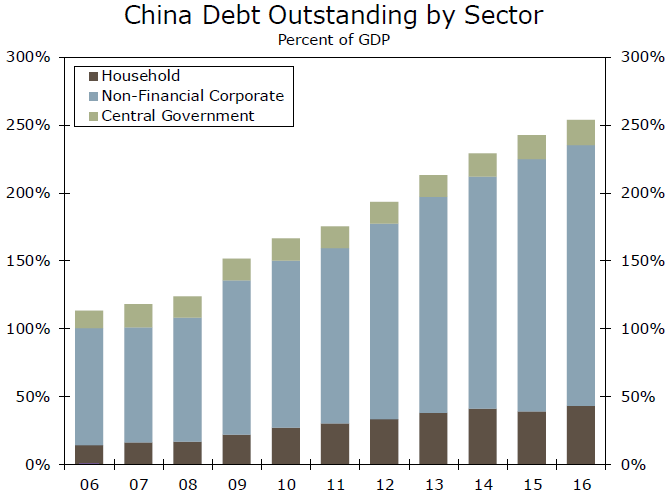
Despite the referenced deleveraging in the household sector, GDP in China rose 6.8% on a year ago basis and 6.9% for the full year 2017 (see chart below left from Wells Fargo). While the 4Q expansion was supported by a resilient consumer sector (retail sales were up 9% during the year) and improving international trade (exports up 4%), a slowdown in investment spending seen over the past several years presents a downside risk to China’s more rapid pace of economic growth. Although the ramp-up in investment spending over the past decade initially contributed to productivity and output gains, China’s corporate sector is now highly leveraged as shown in the chart below right.
Strengthening global demand continued to aid exports and industrial output but the increasing possibility of trade restrictions with the United States is an obvious risk going forward. We look for a slight softening of GDP growth in 2018 towards 6%.
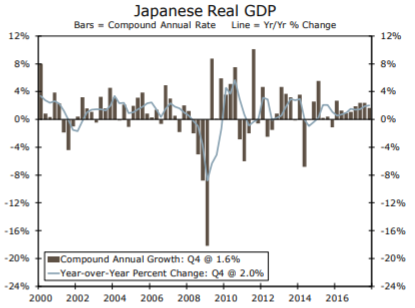
Japan has successfully registered the longest period of uninterrupted growth since the 1986 expansion with GDP rising in each of the past eight quarters. Japan’s economic performance has been slow but sustained. The economy expanded at an upwardly revised rate of 1.6% in 4Q, bringing real GDP to a full year growth rate of 1.7% (see chart below left), the fastest since 2013. Fourth quarter gains were driven by a rebound in personal consumption and business fixed investment.
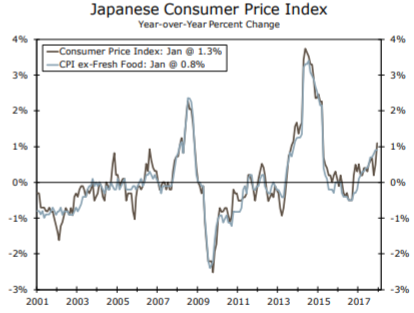
Inflation continues to remain below target as a tighter labor market and strong corporate profits have not translated into higher prices. Wage increases continue to trail productivity growth, reducing upward price pressure. In the final three months of 2017, unit labor costs in Japan retreated on a year-over-year basis for the first time in over two years. Firms have continued to absorb modestly increasing labor costs and this remains a key concern for the Bank of Japan (BOJ) as it has started to slowly reduce their accommodative monetary policy. Though the most recent readings on the consumer price index are still well short of the 2% target (currently at 1.3% in chart below right), these are still much higher than the readings as recently as late 2016 that were negative.
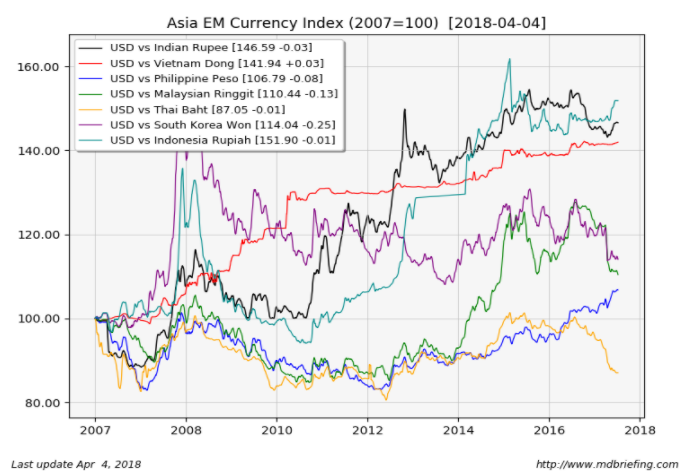
Despite the debt concerns emanating from China and a sustained tightening cycle from the Federal Reserve, emerging markets remain in overall good shape as the 2017 GDP growth rate of 4.5% suggests. Currencies in emerging markets are still viewed by analysts as undervalued despite the recent decline of the U.S dollar. Current reserve positions along with fiscal and current account deficits remain constructive with foreign currency debt having largely been replaced by local currencies which should cushion the impact of movements in money flows. Inflation also remains quiescent so far with several countries also having embarked on economic reforms.
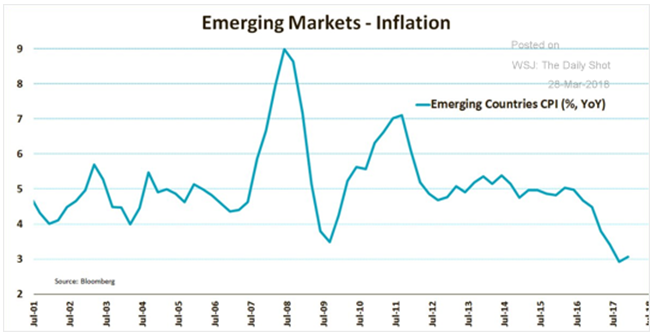
A big factor in both the stable economic environment and low inflation has been the appreciation of many EM currencies against the weakening US dollar. This, along with falling global food prices, contributed to sharply falling inflation in much of the emerging world, allowing many EM central banks to cut interest rates. There may be some early signs of a modest reversal but much of that has to do with base effects.
The El Niño weather phenomenon brought drought and flooding to Latin America in 2015-16, damaging crops and driving up food prices. Prices moderated last year, keeping inflation in check. This effect has now worn off and emerging markets will now anniversary lower readings. Additionally, rising energy and commodity prices may start to show in these readings while robust GDP growth (expected to be around 5% in 2018) should put pressure on wages and prices.
Last year produced a return of over 21% for the S&P 500 index and may go down as the least volatile year in history for the capital markets. In addition to enjoying a positive return in all twelve months of the year, the market did not even experience a drawdown measured from high to low of much over 3%, the first time in history that occurred. We started off 2018 with a continuation of that as January enjoyed a 5.7% total return with investors seeming to believe the market would go up forever. When a trend continues unabatedly in one extreme direction, we often see that followed with a pendulum-like move in the other direction. Welcome to 2018 as volatility is back as capsulated in this astounding data point. In all of 2017, the Standard & Poor’s index closed up or down by 1% or greater on eight occasions but has already done so 23 times through the end of the first quarter of 2018.
The recent correction took the S&P 500 down a little bit over 10% from the peak of 2872 on January 26th to a trough of 2581 on February 8th. The decline feels even worse because of how tranquil markets have been since the last disruption in the early weeks of 2016. Market leadership may also be undergoing a critical change. For the last two years, the major indices have been led by the high-flying tech stocks such as Facebook, Amazon and Google (Alphabet). However, this leadership may recently have been broken as these companies may face the existential threat of increased regulatory scrutiny and supervision. The chart below depicts the annual returns for the S&P 500 dating back to 1980 represented by the blue vertical bars. The number above them shows the total return for each representative year. The red dot below each bar highlights the maximum drawdown within that specific year.
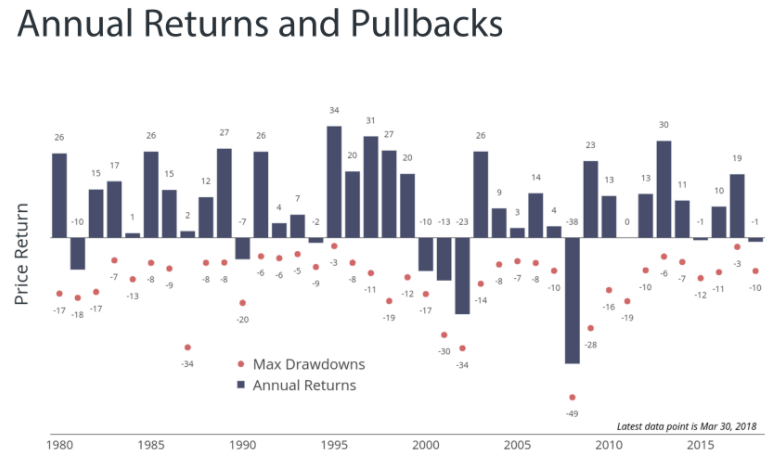
Pullbacks and corrections are normal parts of healthy markets. Some items to note are that in 22 of the 38 years there was at least one peak to trough decline exceeding 10%. In fact, in 16 of those years, the decline was greater than 12% yet none of those 12% or greater declines has occurred since 2011.
Despite the intra-quarter decline of over 10%, the total return for 1Q for the S&P 500 represented a modest drop of -0.76% with the Dow Jones Industrial index declining -1.96%. Due to a strong January, the Russell 1000 Growth index, with a positive contribution of +1.42%, continued to outperform the Russell 1000 Value that declined -2.83% over the full quarter. However, we have seen a clear reversal within these style indices during the corrective phase.
The Russell 2000 index of smaller capitalization companies outperformed with a virtually flat reading of
-0.08%. International indices were mixed with the developed country MSCI EAFE index posting a modest loss of -1.53% while the MSCI Emerging Markets index moved ahead +1.42%
Interest rates rose aggressively during the opening two months of the year with the 10-year Treasury yield rising from 2.41% and broaching 3.00% during the latter part of February. A modest rebound in Treasury prices (lower rates) returned in March, but for the full quarter returns were still negative. The Barclays U.S. Aggregate Bond index had a -1.46% return for the quarter, and the Barclays High Yield index declined a more modest -0.86%.
The Tax Cuts and Jobs Act was passed and signed into law in December 2017 cutting the corporate tax rate from 35% to 21%, while repealing the corporate alternative minimum tax, and scaling back deductions for business interest expenses. According to several estimates, the average effective rate companies paid prior to the tax cut ranged between 24%–27%, significantly lower than the stated rate of 35% as companies had taken advantage of certain tax credits and exemptions. The tax changes will increase after-tax earnings as estimates from the Boston Consulting Group forecast the effective tax rate will now drop into the range of 15%-18%.
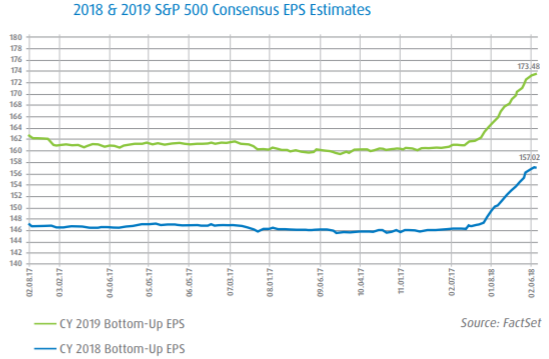
Markets are hopeful that one of the strongest earnings seasons in years can restore the optimism that has been tested over the last two months amid imploding technology leaders and fears of tariffs and trade wars. First-quarter S&P 500 profit growth is anticipated to be the highest in seven years according to data from FactSet.
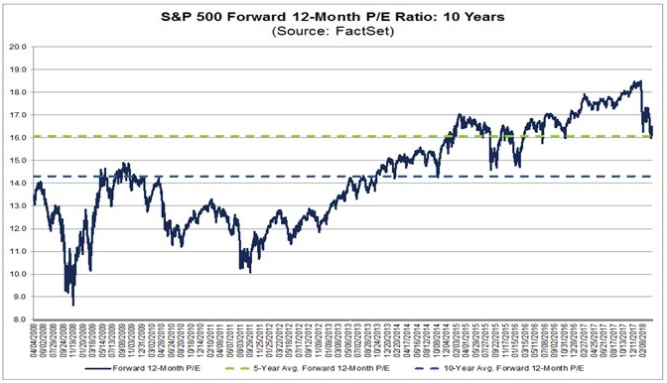
The forward price/earnings ratio at the end of 2017 for the S&P 500 hit an almost 20-year high of 18.5x but
has since compressed to 16.5x (see chart on following page from FactSet). This compares to the long run norm of 15x. The majority of this contraction has been due to the upwardly revised corporate earnings picture from the tax cuts, with analysts now expecting first-quarter earnings for the index to rise over 17% from year ago levels.
The bar has now been set quite high for a market that by most valuation metrics remains elevated. At Coho Partners our focus remains on downside protection. We seek to provide this from the construction of a differentiated portfolio populated with high quality companies with resilient earnings streams, growing dividends, strong balance sheets and reasonable levels of expectations and valuations. At a time when global central banks and the Federal Reserve seem intent on removing much of the interest rate accommodation that has lifted asset values to elevated levels, we feel this philosophy is very well suited to address the challenges facing investors.
Sincerely,
Rick S. Wayne, CFA
Eric M. Hildenbrand, CFA
The views, opinions, and content presented are for informational purposes only. They are not intended to reflect a current or past recommendation; investment, legal, tax, or accounting advice of any kind; or a solicitation of an offer to buy or sell any securities or investment services. Nothing presented should be considered to be an offer to provide any Coho product or service in any jurisdiction that would be unlawful under the securities laws of that jurisdiction. Past performance is no guarantee of future results. There can be no assurance that the portfolio will be successful in limiting volatility.
